
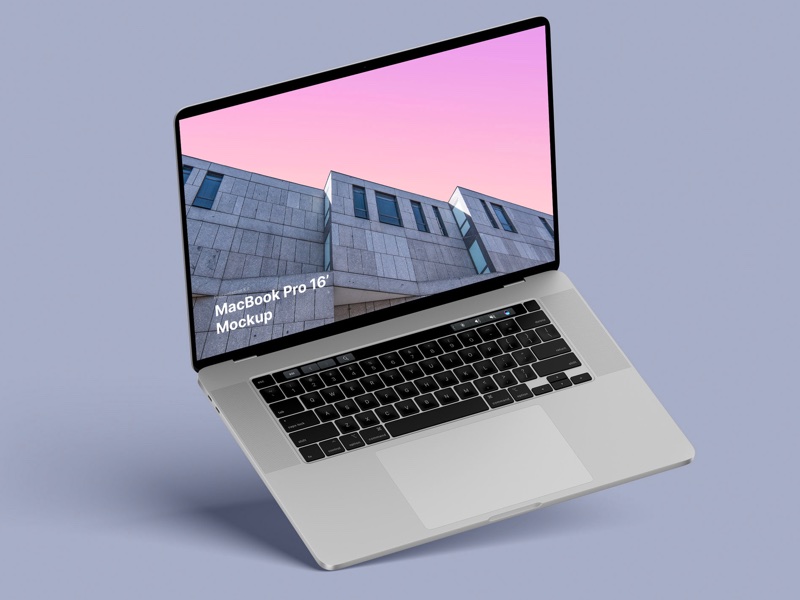
MacBook Pro 16” Mockups 🔥
– in 4 materials (clay versions included)
– 12 scenes
– 48 MacBook Pro 16″ mockups
– 6000 x 4500 px
– in 4 materials (clay versions included)
– 12 scenes
– 48 MacBook Pro 16″ mockups
– 6000 x 4500 px
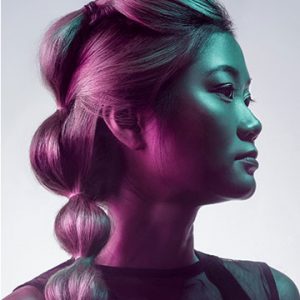
Learn how to rescue details, remove flyaways, add volume, and enhance the definition of hair in any photo. We break down every tool and technique in Photoshop to get picture-perfect hair, every time.
Nice and short text about related topics in discussion sections


