
MacBook Pro 16” Mockups 🔥
– in 4 materials (clay versions included)
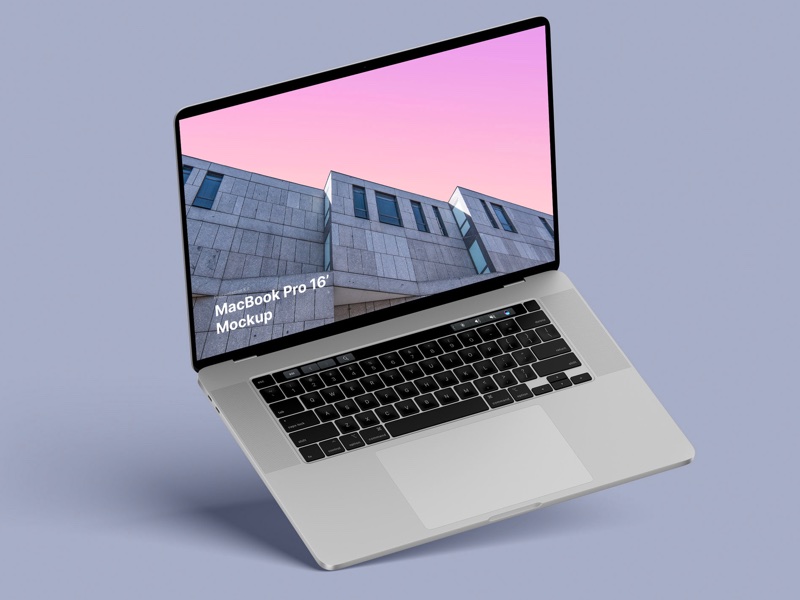
– 12 scenes
– 48 MacBook Pro 16″ mockups
– 6000 x 4500 px
– in 4 materials (clay versions included)
– 12 scenes
– 48 MacBook Pro 16″ mockups
– 6000 x 4500 px
Nice and short text about related topics in discussion sections